Cats vs dogs. Pepsi vs Coke. Star Wars vs Star Trek. Some rivalries are truly timeless, and the divide between football and rugby fans often feels like one of them.
Of course, there are plenty of people who enjoy both sports, but it’s fair to say that football fans are, by and large, perceived as a very separate group from their rugby-loving counterparts - and that these two sets of supporters also have quite different reputations.
Here at TOFFS, we sell retro rugby shirts as well as old-school football tops, so we thought we’d run a survey to get a feel of how the British public perceives both groups of fans, and to see which of them has the better reputation. A total of 562 people responded to the poll - and the results were pretty eye-opening!
Football fans take a kicking!
Across the board, there was a clear winner in terms of which fan group is regarded more positively - and the results make for some grim reading for football supporters.
Our survey asked people to judge whether they associated certain words - ranging from “classy”, “welcoming” and “well-informed”, to “dull”, “uneducated” and “full of themselves"- with a specific group of fans. Our respondents ended up linking the vast majority of the negative terms to football fans, while describing rugby fans in mostly glowing terms!
-
More than 90% described football fans as loud, aggressive, obsessive, disrespectful, uneducated and out of control; less than 20% described them as well-behaved, mature or classy
-
By contrast, more than 85% described rugby fans as well-behaved, mature, welcoming and classy; less than 15% described them as disrespectful, uneducated, aggressive or out of control.
-
The most common negative phrase associated with rugby fans was “elitist”, with 77% using this term; conversely, the most common positive sentiment associated with football fans was “down to earth”, with 60% picking out this phrase.
Elsewhere, the survey revealed that 85% of people believe that football fans cause more trouble than rugby fans, with only 4% prepared to say the opposite. Perhaps because of this, 40% said that if they were faced with the choice between sitting next to a rugby or football fan on a busy 90-minute train journey, they would pick the rugby lover - compared to only 16% who would sit next to the football fanatic.
What do people like and dislike about football and rugby fans?
These conclusions don’t paint a pretty picture for fans of footie, but it wasn’t all bad; for example, 51% of those polled said football fans have better songs than rugby fans, with only 22% saying the opposite and 26% undecided. Similarly, 44% said football fans are more passionate, while only 14% were prepared to argue that rugby has the more committed supporters.
When asked directly about what they liked and disliked most about football and rugby fans, the results were very telling:
-
Asked to identify what they liked most about football fans, the respondents to our survey used the word “passionate” a lot, as well as citing the loyalty, songs, banter and humour that people associated with the sport. This shows that football supporters, for all their perceived flaws, are widely seen as enthusiastic supporters who are likeably committed to their team and their fellow fans.
-
When it came to rugby fans, passion and loyalty were also cited as key positive points, alongside phrases like “friendly”, “well-behaved”, “welcoming” and “camaraderie”, underlining the point that rugby crowds are often seen as less raucous but better-natured than their football counterparts.
-
On the negative side of things, rugby fans were most likely to be disliked for their drinking, loudness, elitism and poshness, as well as accusations of being boring.
-
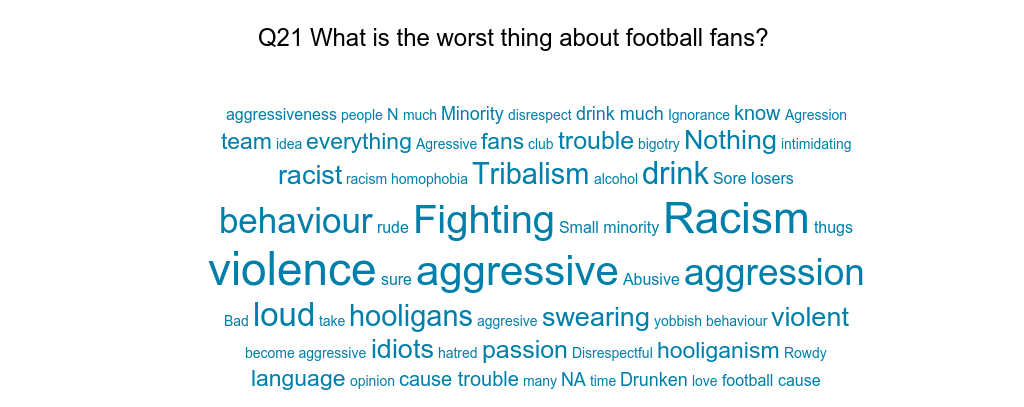
More seriously, football fans were shown to be viewed warily due to suspicions of violence, aggression, fighting, drunkenness, tribalism and even racism - indicating that the sport is still struggling to shrug off the image of the old-school football hooligan.
Which teams have the best and worst reputations?
Of course, sports fan culture is not a monolith; every team’s support base tends to have its own quirks and reputational challenges, and our survey shows that this has not gone unnoticed by the British public.
-
When asked which football team has the best fans, the most popular answer was Liverpool FC, with 11% of the vote, followed by Arsenal and Manchester United at 6% each.
-
On the opposite end of the scale was the infamous Millwall FC, which was picked out as having the worst fans by a whopping 25% of respondents.
-
On the rugby side of things, Wigan were picked as the rugby league team with the best fans (8%), while St Helens was the most common pick for the worst fanbase (5%).
-
Rugby union sides Harlequins and Leicester came top of their category for best fans (6%), but Leicester somehow also ranked ahead of the pack in terms of having the worst fans, with 4% of the vote.
Interestingly, the number of people who said they simply had no strong opinion on the questions relating to which rugby sides had the best or worst fans varied between 40% and 65%, making this the most common answer. This suggests that rugby teams may not have the same distinct cultural reputations as their football counterparts - a stark contrast to Millwall, which was consistently ranked as the football team with the worst fans even among those who identified primarily as rugby fans, as well as those who were not fans of either sport.
The complete survey findings
For more insights into how the British public sees football and rugby fans, check out the full survey findings below.
Would you identify more as a football fan, or a rugby fan?
|
% |
Number of people |
|
|
Football |
55.52% |
312 |
|
Rugby |
24.38% |
137 |
|
Both equally |
10.14% |
57 |
|
Neither |
9.96% |
56 |
Which of the following words would you associate with football/rugby fans?
|
Football fans |
Rugby fans |
|||
|
% |
Number of people |
% |
Number of people |
|
|
Classy |
18.26% |
44 |
85.48% |
206 |
|
Welcoming |
29.11% |
115 |
86.33% |
341 |
|
Aggressive |
92.73% |
357 |
11.95% |
46 |
|
Well-informed |
55.56% |
200 |
74.72% |
269 |
|
A good laugh |
58.12% |
254 |
72.08% |
315 |
|
Good-looking |
50.46% |
110 |
60.55% |
132 |
|
Dull |
56.06% |
111 |
49.49% |
98 |
|
Obsessive |
92.49% |
345 |
26.27% |
98 |
|
Out of control |
94.18% |
259 |
10.18% |
28 |
|
Elitist |
26.83% |
66 |
76.83% |
189 |
|
Mature |
15.41% |
43 |
89.96% |
251 |
|
Socially conscious |
31.47% |
73 |
75.86% |
176 |
|
Interesting |
52.50% |
147 |
68.57% |
192 |
|
Down to earth |
60.00% |
210 |
57.71% |
202 |
|
Well-behaved |
9.85% |
33 |
95.22% |
319 |
|
Uneducated |
92.06% |
197 |
12.15% |
26 |
|
Full of themselves |
69.90% |
202 |
39.45% |
114 |
|
Loud |
91.73% |
388 |
37.12% |
157 |
|
Annoying |
83.10% |
236 |
26.76% |
76 |
|
Disrespectful |
93.27% |
277 |
12.46% |
37 |
Would you rather see your nation lift football’s World Cup or the Rugby World Cup?
|
% |
Number of people |
|
|
Football World Cup |
57.30% |
322 |
|
Rugby World Cup |
28.65% |
161 |
|
Wouldn’t care either way |
14.06% |
79 |
You board a train for a 90-minute journey, with only two free seats - one adjacent to a football fan, the other next to a rugby fan. Where do you sit?
|
% |
Number of people |
|
|
Football fan |
15.84% |
89 |
|
Rugby fan |
40.57% |
228 |
|
Wouldn’t mind either way |
40.04% |
225 |
|
Stay standing! |
3.56% |
20 |
Would you rather date a massive football fan, or a massive rugby fan?
|
% |
Number of people |
|
|
Football fan |
38.79% |
218 |
|
Rugby fan |
34.88% |
196 |
|
Wouldn’t mind either way |
26.33% |
148 |
Who has better songs - rugby or football fans?
|
% |
Number of people |
|
|
Football fans |
51.25% |
288 |
|
Rugby fans |
22.42% |
126 |
|
Neither of them |
26.33% |
148 |
Which set of fans are more passionate - football or rugby fans?
|
% |
Number of people |
|
|
Football fans |
43.77% |
246 |
|
Rugby fans |
14.23% |
80 |
|
Can’t decide |
41.99% |
236 |
Who causes more trouble - football or rugby fans?
|
% |
Number of people |
|
|
Football fans |
84.52% |
475 |
|
Rugby fans |
4.45% |
25 |
|
Can’t decide |
11.03% |
62 |
Do you think football fans deserve their current reputation?
|
% |
Number of people |
|
|
Their reputation is better than they deserve |
9.96% |
56 |
|
Their reputation is worse than they deserve |
28.29% |
159 |
|
Their reputation is as positive as it should be |
18.68% |
105 |
|
Their reputation is as negative as it should be |
20.28% |
114 |
|
No strong opinion |
22.78% |
128 |
Do you think rugby fans deserve their current reputation?
|
% |
Number of people |
|
|
Their reputation is better than they deserve |
10.68% |
60 |
|
Their reputation is worse than they deserve |
7.47% |
42 |
|
Their reputation is as positive as it should be |
47.15% |
265 |
|
Their reputation is as negative as it should be |
1.78% |
10 |
|
No strong opinion |
32.92% |
185 |
What is the BEST thing about football fans?

What is the BEST thing about rugby fans?

What is the WORST thing about rugby fans?

Which football team has the BEST fans?
|
% |
Number of people |
|
|
Liverpool |
10.85% |
61 |
|
Arsenal |
6.23% |
35 |
|
Manchester United |
5.69% |
32 |
|
Newcastle United |
4.45% |
25 |
|
Chelsea |
3.74% |
21 |
|
Manchester City |
3.56% |
20 |
|
Wolverhampton Wanderers |
3.38% |
19 |
|
Leeds United |
3.02% |
17 |
|
Norwich City |
2.67% |
15 |
|
Tottenham Hotspur |
2.67% |
15 |
|
Everton |
2.49% |
14 |
|
Cardiff City |
2.31% |
13 |
|
Aston Villa |
2.14% |
12 |
|
Celtic |
1.96% |
11 |
|
Leicester City |
1.60% |
9 |
|
West Ham United |
1.60% |
9 |
|
West Bromwich Albion |
1.60% |
9 |
|
Crystal Palace |
1.42% |
8 |
|
Sheffield Wednesday |
1.42% |
8 |
|
Derby County |
1.25% |
7 |
|
Stoke City |
1.25% |
7 |
|
Aberdeen |
1.25% |
7 |
|
Southampton |
1.07% |
6 |
|
Watford |
1.07% |
6 |
|
Blackburn Rovers |
1.07% |
6 |
|
Bournemouth |
0.89% |
5 |
|
Brighton & Hove Albion |
0.89% |
5 |
|
Fulham |
0.89% |
5 |
|
Rangers |
0.89% |
5 |
|
Burnley |
0.71% |
4 |
|
Bristol City |
0.71% |
4 |
|
Huddersfield Town |
0.71% |
4 |
|
Middlesbrough |
0.71% |
4 |
|
Millwall |
0.71% |
4 |
|
Swansea City |
0.71% |
4 |
|
Wigan Athletic |
0.71% |
4 |
|
Heart of Midlothian |
0.71% |
4 |
|
Brentford |
0.53% |
3 |
|
Hull City |
0.53% |
3 |
|
Nottingham Forest |
0.53% |
3 |
|
Hibernian |
0.53% |
3 |
|
Sheffield United |
0.36% |
2 |
|
Barnsley |
0.36% |
2 |
|
Birmingham City |
0.36% |
2 |
|
Charlton Athletic |
0.36% |
2 |
|
Luton Town |
0.18% |
1 |
|
Preston North End |
0.18% |
1 |
|
Queens Park Rangers |
0.18% |
1 |
|
Hamilton Academical |
0.18% |
1 |
|
Kilmarnock |
0.18% |
1 |
|
St Johnstone |
0.18% |
1 |
|
St Mirren |
0.18% |
1 |
|
No strong opinion |
11.39% |
64 |
|
Other |
4.80% |
27 |
Which football team has the WORST fans?
|
% |
Number of people |
|
|
Millwall |
25.62% |
144 |
|
Chelsea |
7.83% |
44 |
|
Manchester United |
7.65% |
43 |
|
Liverpool |
6.94% |
39 |
|
Arsenal |
5.34% |
30 |
|
Rangers |
4.27% |
24 |
|
Leeds United |
4.09% |
23 |
|
Celtic |
2.85% |
16 |
|
Tottenham Hotspur |
2.67% |
15 |
|
West Ham United |
2.14% |
12 |
|
Burnley |
1.42% |
8 |
|
Birmingham City |
1.42% |
8 |
|
Newcastle United |
1.25% |
7 |
|
Manchester City |
1.07% |
6 |
|
Cardiff City |
1.07% |
6 |
|
Fulham |
1.07% |
6 |
|
Stoke City |
1.07% |
6 |
|
Wolverhampton Wanderers |
0.89% |
5 |
|
Aberdeen |
0.89% |
5 |
|
Aston Villa |
0.53% |
3 |
|
Brighton & Hove Albion |
0.53% |
3 |
|
Everton |
0.53% |
3 |
|
Norwich City |
0.53% |
3 |
|
Barnsley |
0.53% |
3 |
|
Bournemouth |
0.36% |
2 |
|
Crystal Palace |
0.36% |
2 |
|
Watford |
0.36% |
2 |
|
Charlton Athletic |
0.36% |
2 |
|
Derby County |
0.36% |
2 |
|
Luton Town |
0.36% |
2 |
|
Nottingham Forest |
0.36% |
2 |
|
Queens Park Rangers |
0.36% |
2 |
|
Sheffield Wednesday |
0.36% |
2 |
|
West Bromwich Albion |
0.36% |
2 |
|
Leicester City |
0.18% |
1 |
|
Sheffield United |
0.18% |
1 |
|
Blackburn Rovers |
0.18% |
1 |
|
Middlesbrough |
0.18% |
1 |
|
Swansea City |
0.18% |
1 |
|
Wigan Athletic |
0.18% |
1 |
|
No strong opinion |
9.61% |
54 |
|
Other |
3.56% |
20 |
Which rugby league team has the BEST fans?
|
% |
Number of people |
|
|
Wigan |
8.01% |
45 |
|
Leeds |
6.23% |
35 |
|
St Helens |
5.16% |
29 |
|
Warrington |
3.91% |
22 |
|
Hull FC |
3.74% |
21 |
|
Castleford |
3.20% |
18 |
|
London Broncos |
3.02% |
17 |
|
Salford |
2.85% |
16 |
|
Wakefield |
2.85% |
16 |
|
Glasgow RL |
2.31% |
13 |
|
Huddersfield |
2.14% |
12 |
|
Hull KR |
1.42% |
8 |
|
Edinburgh Eagles |
1.07% |
6 |
|
Catalans |
0.53% |
3 |
|
Fife Lions |
0.18% |
1 |
|
Strathmore Silverbacks |
0.18% |
1 |
|
No strong opinion |
49.47% |
278 |
|
Other |
3.74% |
21 |
Which rugby league team has the WORST fans?
|
% |
Number of people |
|
|
St Helens |
4.80% |
27 |
|
Leeds |
4.27% |
24 |
|
Glasgow RL |
3.74% |
21 |
|
Hull KR |
2.85% |
16 |
|
London Broncos |
2.67% |
15 |
|
Hull FC |
2.49% |
14 |
|
Castleford |
2.14% |
12 |
|
Huddersfield |
2.14% |
12 |
|
Warrington |
2.14% |
12 |
|
Wigan |
2.14% |
12 |
|
Salford |
1.96% |
11 |
|
Wakefield |
1.60% |
9 |
|
Edinburgh Eagles |
1.60% |
9 |
|
Catalans |
1.25% |
7 |
|
Other (please specify) |
1.25% |
7 |
|
Strathmore Silverbacks |
0.89% |
5 |
|
No strong opinion |
61.39% |
345 |
|
Other |
1.25% |
7 |
Which rugby union team has the BEST fans?
|
% |
Number of people |
|
|
Harlequins |
5.87% |
33 |
|
Leicester |
5.87% |
33 |
|
Bath |
4.45% |
25 |
|
Saracens |
4.27% |
24 |
|
Wasps |
3.91% |
22 |
|
Exeter |
3.56% |
20 |
|
Sale |
3.56% |
20 |
|
Northampton |
3.38% |
19 |
|
London Irish |
2.67% |
15 |
|
Glasgow |
2.49% |
14 |
|
Bristol |
2.14% |
12 |
|
Gloucester |
2.14% |
12 |
|
Worcester |
1.96% |
11 |
|
Cardiff Blues |
1.96% |
11 |
|
Edinburgh |
1.96% |
11 |
|
Scarlets |
1.25% |
7 |
|
Dragons |
1.07% |
6 |
|
Ulster |
1.07% |
6 |
|
Ospreys |
0.89% |
5 |
|
Leinster |
0.71% |
4 |
|
Munster |
0.53% |
3 |
|
Connacht |
0.18% |
1 |
|
No strong opinion |
42.35% |
238 |
|
Other |
1.78% |
10 |
Which rugby union team has the WORST fans?
|
% |
Number of people |
|
|
Leicester |
3.56% |
20 |
|
Saracens |
3.38% |
19 |
|
London Irish |
2.67% |
15 |
|
Northampton |
2.49% |
14 |
|
Wasps |
2.49% |
14 |
|
Bristol |
1.96% |
11 |
|
Edinburgh |
1.96% |
11 |
|
Gloucester |
1.78% |
10 |
|
Sale |
1.78% |
10 |
|
Cardiff Blues |
1.78% |
10 |
|
Glasgow |
1.60% |
9 |
|
Harlequins |
1.25% |
7 |
|
Bath |
1.07% |
6 |
|
Scarlets |
1.07% |
6 |
|
Dragons |
0.89% |
5 |
|
Connacht |
0.71% |
4 |
|
Leinster |
0.71% |
4 |
|
Ospreys |
0.71% |
4 |
|
Ulster |
0.71% |
4 |
|
Worcester |
0.53% |
3 |
|
Munster |
0.53% |
3 |
|
Exeter |
0.18% |
1 |
|
No strong opinion |
65.30% |
367 |
|
Other |
0.89% |
5 |


